

The economic and social uncertainties of the past few years put strain on most organizations as they struggled to maintain consistency amid dramatically changing conditions. For many leaders, the incremental effort of developing or executing DEI programs may not always seem to be the best use of resources. However, data from the “2022 State of DEI” report by BetterWork Media Group, Talent Management’s parent organization, suggests otherwise.
The first review of DEI’s progression and status was prepared by BMG’s research arm. While maintaining their anonymity, 487 Talent Management subscribers were asked to provide background information and status of DEI efforts in their organizations. Here is a summary of the results and highlights of the report.
Growing staffs and budgets
Although elements of DEI have been on many organizations’ agendas for nearly three decades, the past three years have seen a coalescence of ideas and efforts. While DEI is not a “new concern,” the behavior and numbers around it are indicative of startup status. In fact, were “DEI” a typical startup, it would not be unusual for it to take three to four years to become established and stable. With that in mind, nearly three-quarters of respondents indicated their DEI efforts were less than five years old and more than half said the efforts were less than two years old (Figure 1).
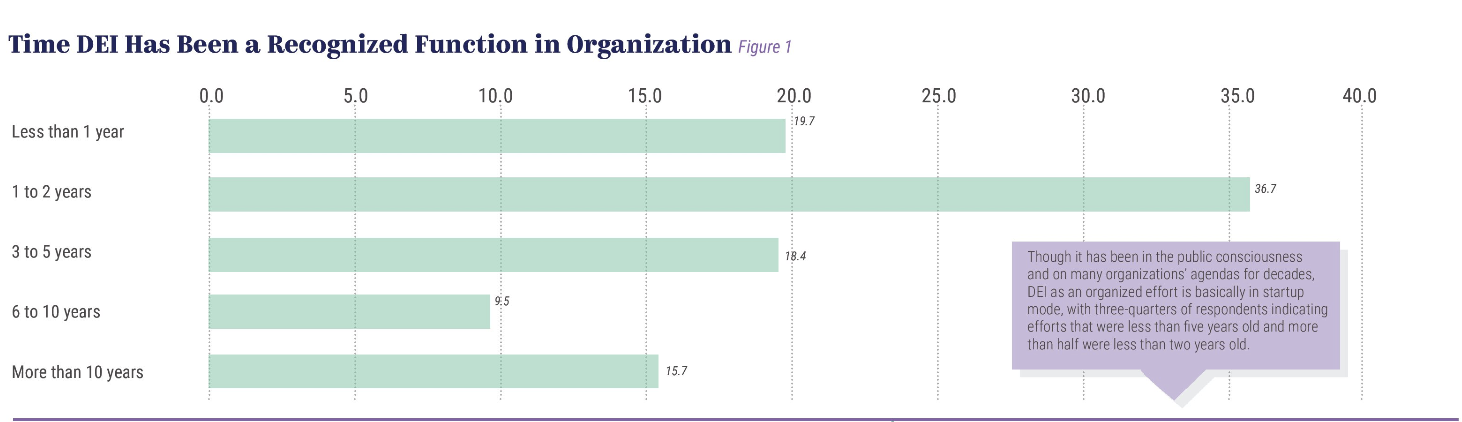
Further, only 15 percent reported having a DEI function for more than 10 years, and the majority of those were organizations in government and academia that have been among the leaders in DEI development.
With limited trend data to look back on, two current metrics tell the DEI outlook story: staffing and budget. Staffing for DEI in most organizations consisted of teams of one to five people. But over the past 12 to 18 months, nearly 65 percent of organizations increased their DEI staff, 30 percent maintained existing staffing levels and only 6 percent reported a reduction. More than half of publicly held, nonprofit and government organizations reported year-over-year increases, and half of privately held and academic organizations said they were holding DEI staffing levels constant.
Budget patterns across organization types were almost identical to staffing patterns. Primarily but not wholly due to the increases in staffing, a third of respondents said their DEI budgets had increased, a third said they had not changed and a third said they weren’t sure.
Budgets are also reflective of performance and, as DEI programs continue to develop, their ability to deliver positive benefits will determine how much of an organization’s financial resources will be allocated to supporting them. Overall, with 65 percent of organizations increasing staffing levels and 61 percent reporting budgets at or above those of the previous year, activity and growth behind DEI efforts is projected to continue.
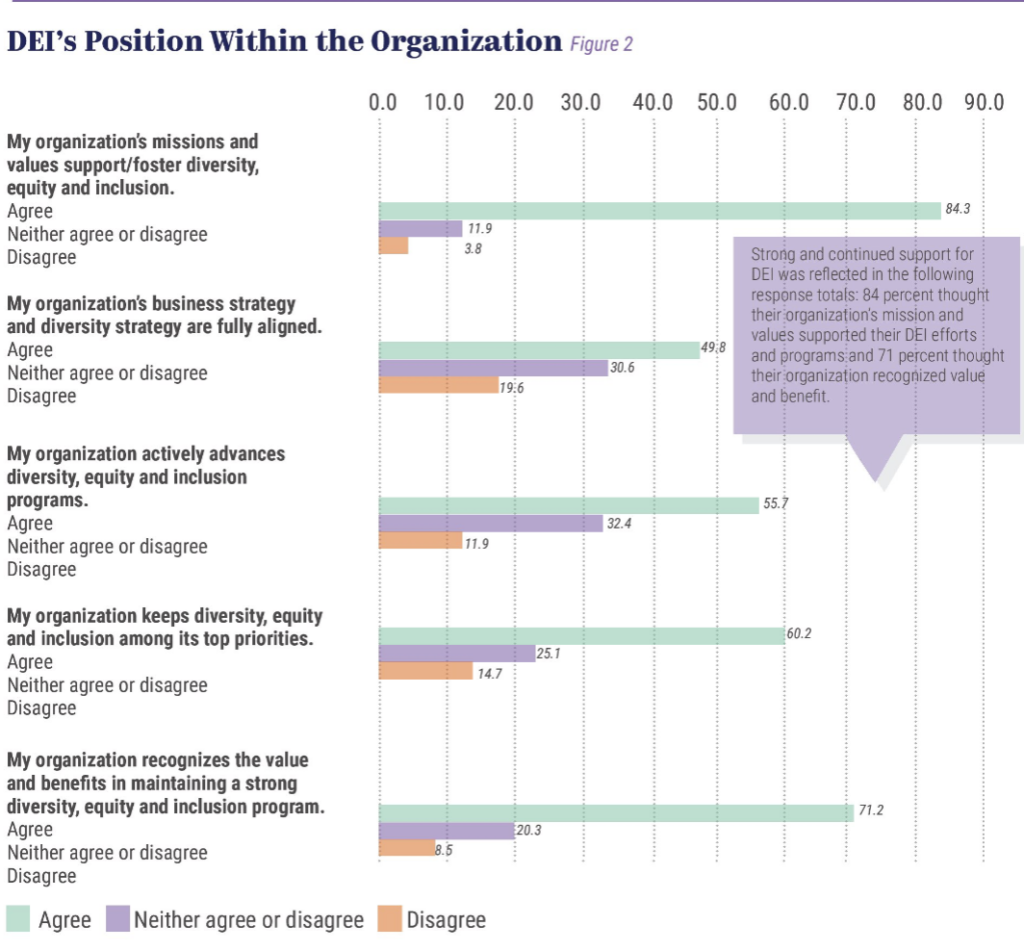
In terms of DEI’s position within the organization, strong and continued support for DEI was reflected in the following response totals: 84 percent thought their organization’s mission and values supported their DEI efforts and programs and 71 percent thought their organization recognized value and benefit from the DEI programs in place. However, only about half (56 percent) thought their organization actively advanced their DEI programs (Figure 2).
DEI in practice
With a high percentage of respondents indicating early-stage DEI development, efforts to expand the scope of DEI’s target audience were limited. For the third of organizations looking to expand their DEI targets externally, resellers and contractors were their targets. But for most organizations, DEI activity is focused internally, as efforts were directed at organizational leadership (78 percent), mid-level management (73 percent), established employees (68 percent) and entry-level employees (68 percent) (Figure 3).
More than half of respondents felt their DEI efforts served 76 percent or more of their organization’s full-time employees, though alarmingly, 24 percent weren’t sure who their DEI programs were serving.
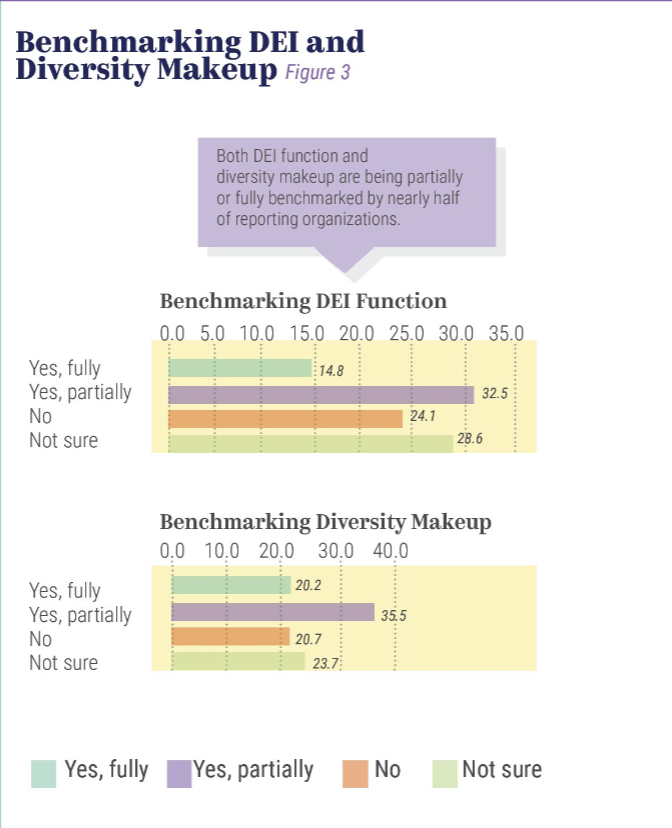
The report also looked at whether DEI metrics are being gathered, tracked and reviewed. Data showed that both DEI function and diversity makeup are being partially or fully benchmarked by nearly half of reporting organizations (Figure 4).
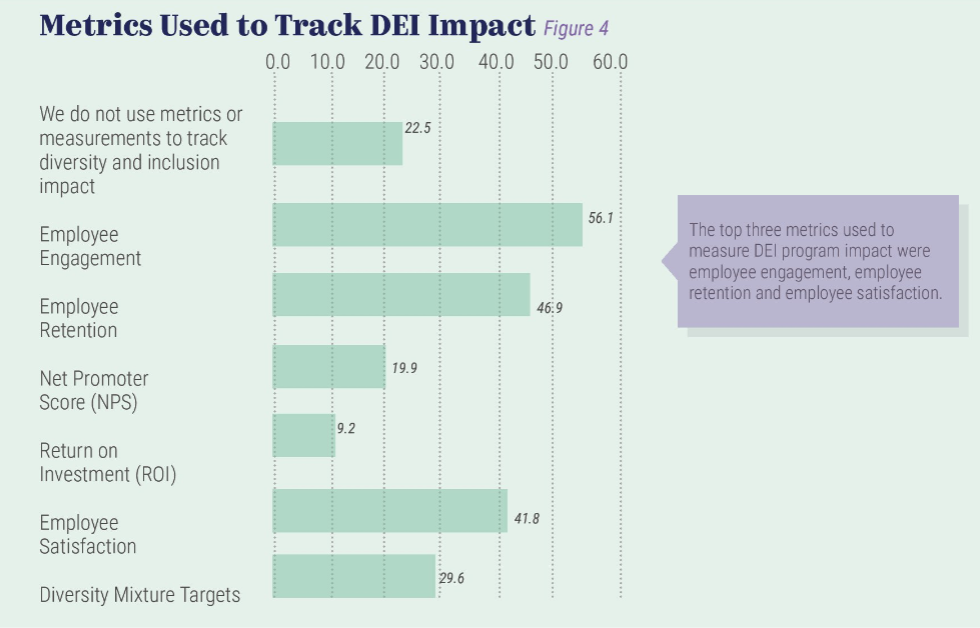
Two numbers are expected to be significantly lower as DEI experience and metrics grow: organizations not benchmarking (24 percent) and respondents not sure whether their organizations benchmark (29 percent).
The top three metrics used to measure DEI program impact were employee engagement (56 percent), employee retention (47 percent) and employee satisfaction (42 percent), all of which are subjective. Objective metrics had the least reported use: net promoter score and return on investment, at 20 percent and 9 percent respectively. About 23 percent reported they do not use metrics to track diversity and inclusion impact (Figure 5).
Where DEI was once seen as an obligatory effort, it is rapidly becoming integral to the way organizations regard and manage their employees. Rather than treating it as compliance, progressive-minded organizations have proven that a well-developed and consistently executed DEI effort can improve their operations and enhance their bottom lines.
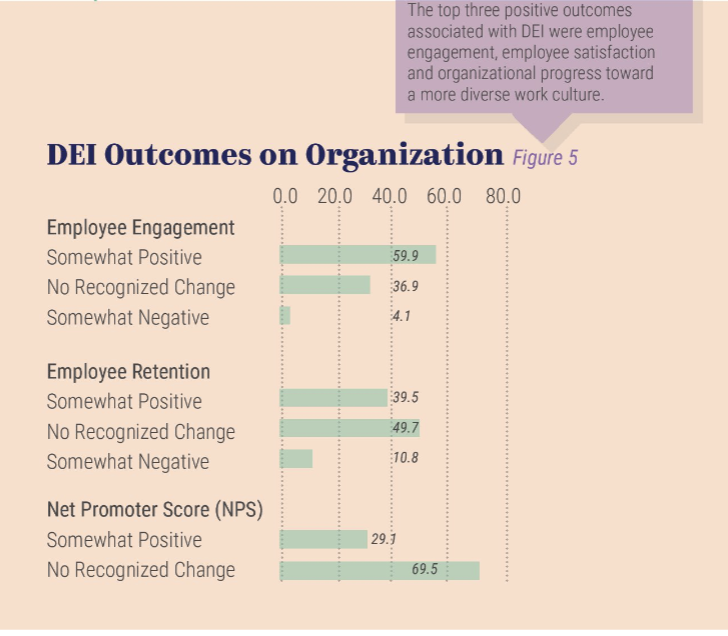
The top three positive outcomes associated with DEI were employee engagement (60 percent), employee satisfaction (54 percent) and organizational progress toward a more diverse work culture (53 percent). Outcomes that did not register recognizable year-over-year changes were ROI (72 percent), NPS (70 percent) and employee retention (50 percent).